
Dashboard tour
The dashboard is where you watch traffic, tune security, and manage billing for your gateway. The sidebar groups pages into Monitor (what happened), Manage (the controls that shape requests), Gateway (the model catalog), and Workspace (account and team). This page walks through each, and calls out the ones you will use most.
Overview
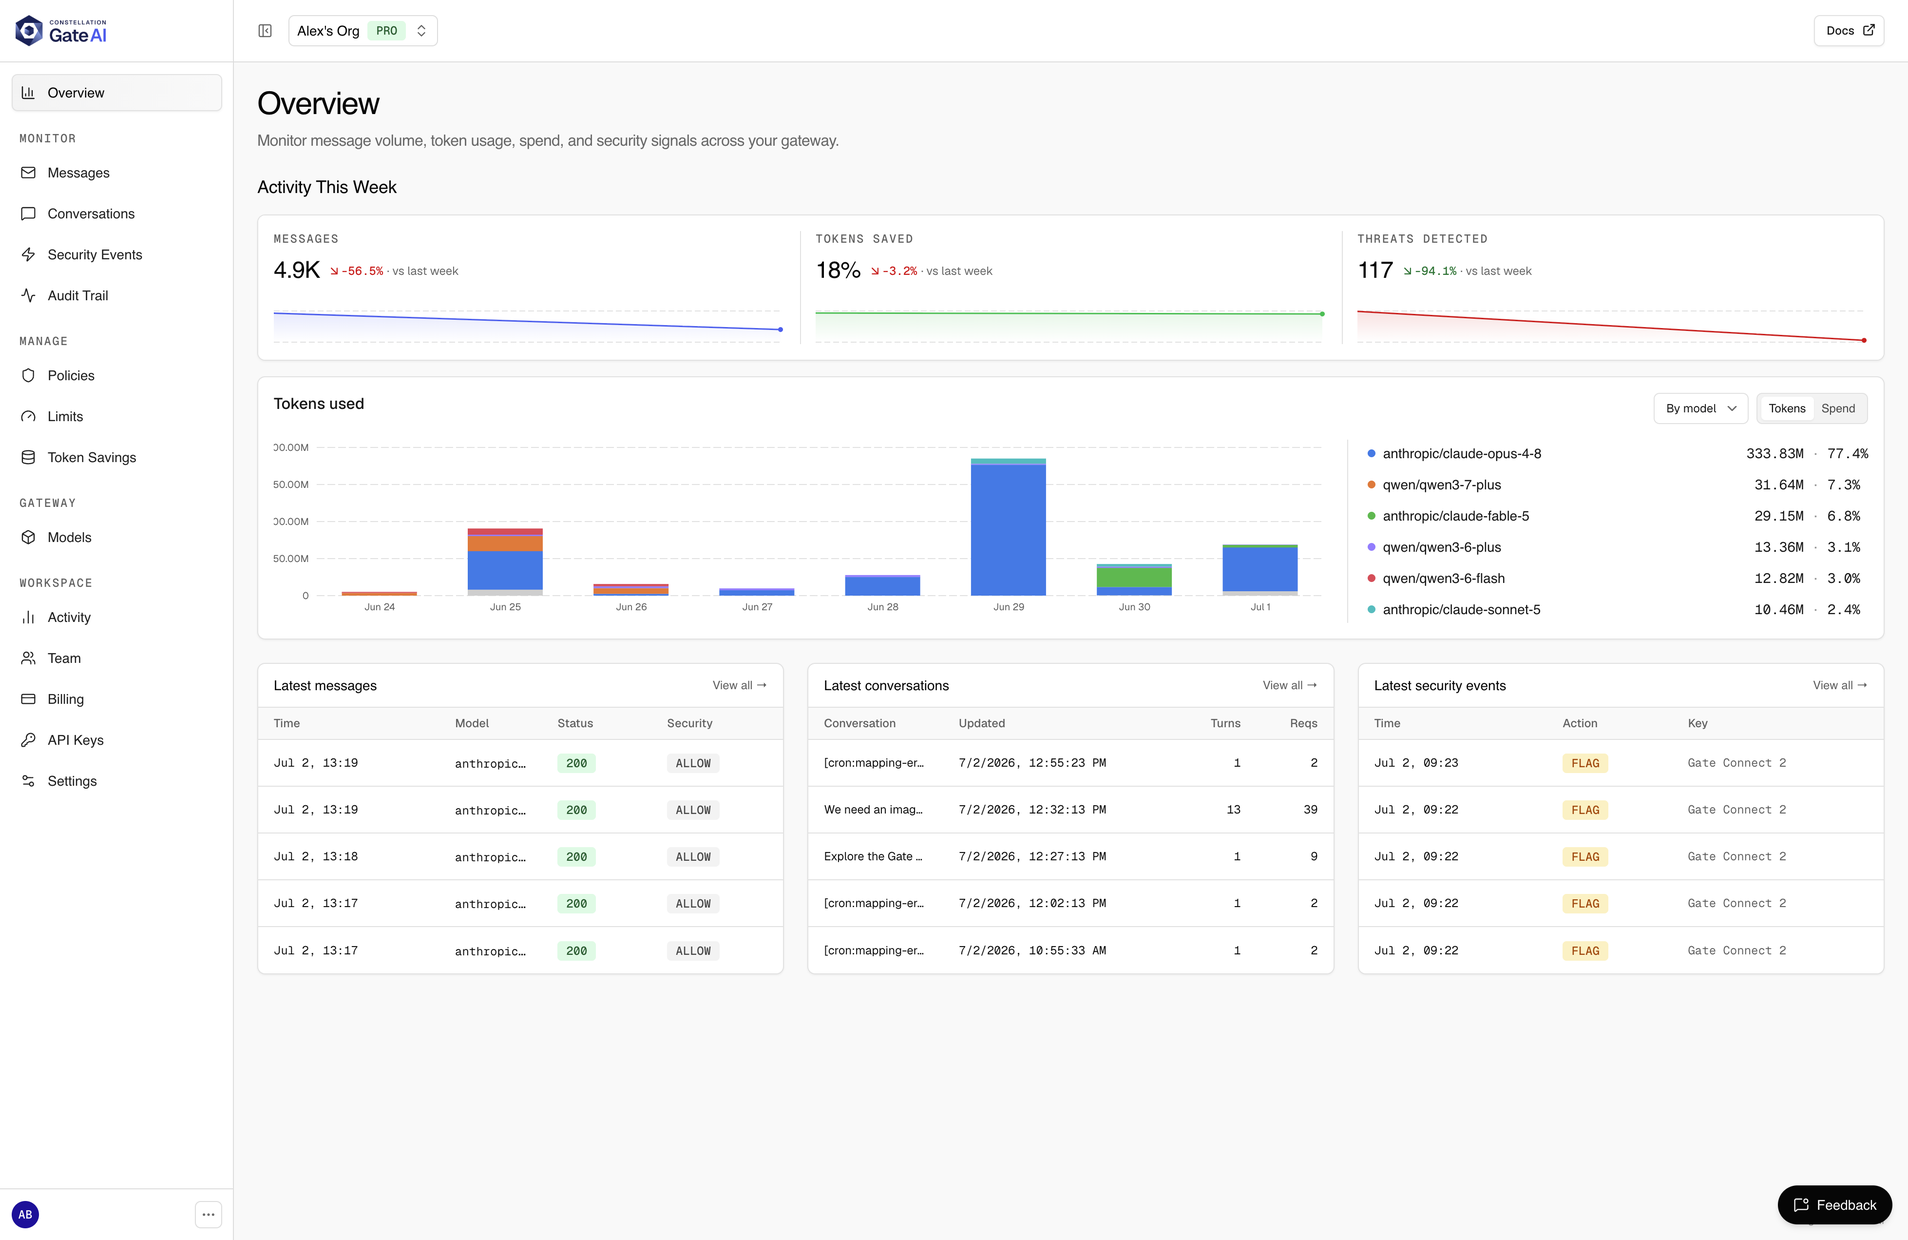
Your landing page after signing in. The top row tracks message volume, tokens saved, and threats detected for the week. Below it, a tokens-used chart breaks usage down by model, and three live feeds show your latest messages, conversations, and security events.
Monitor
Everything that already happened, after the fact.
Messages
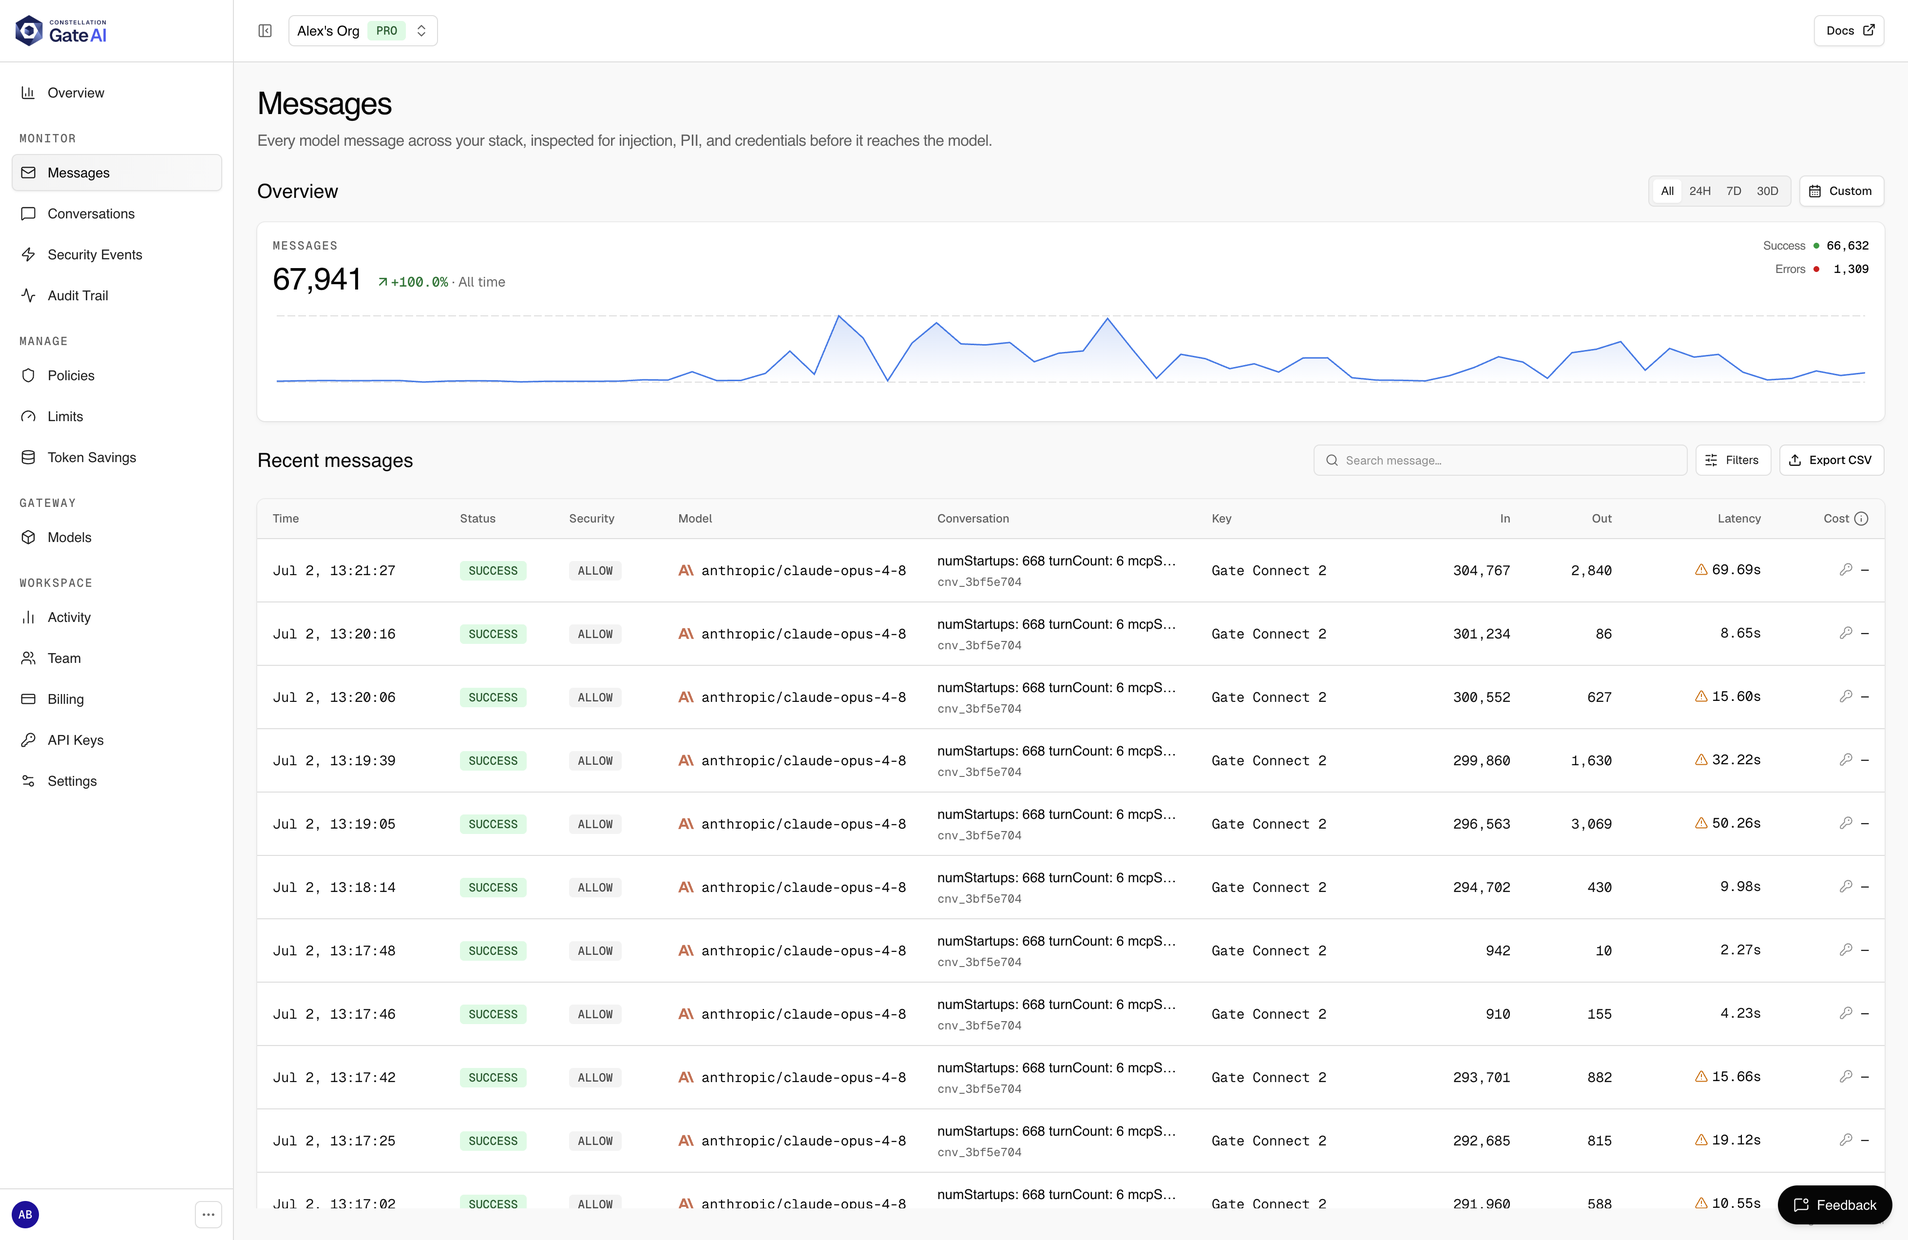
The core log. Every model message across your stack, inspected for injection, PII, and credentials before it reaches the model. Each row shows status, security result, model, token counts, latency, and cost. Filter by provider, model, status, time range, security result, or key, search the message body, or export to CSV.
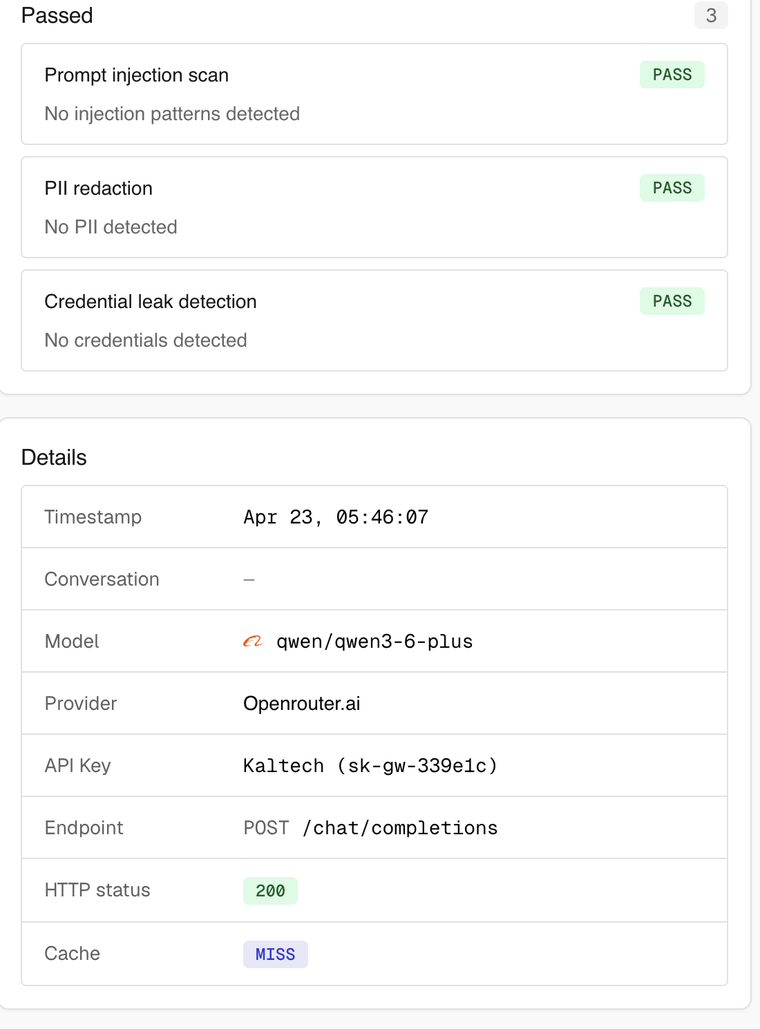
Open any message for the full record: the prompt and response, the security scans it passed or failed, and request metadata such as the model, provider, endpoint, HTTP status, and whether the response was a cache hit.
Conversations
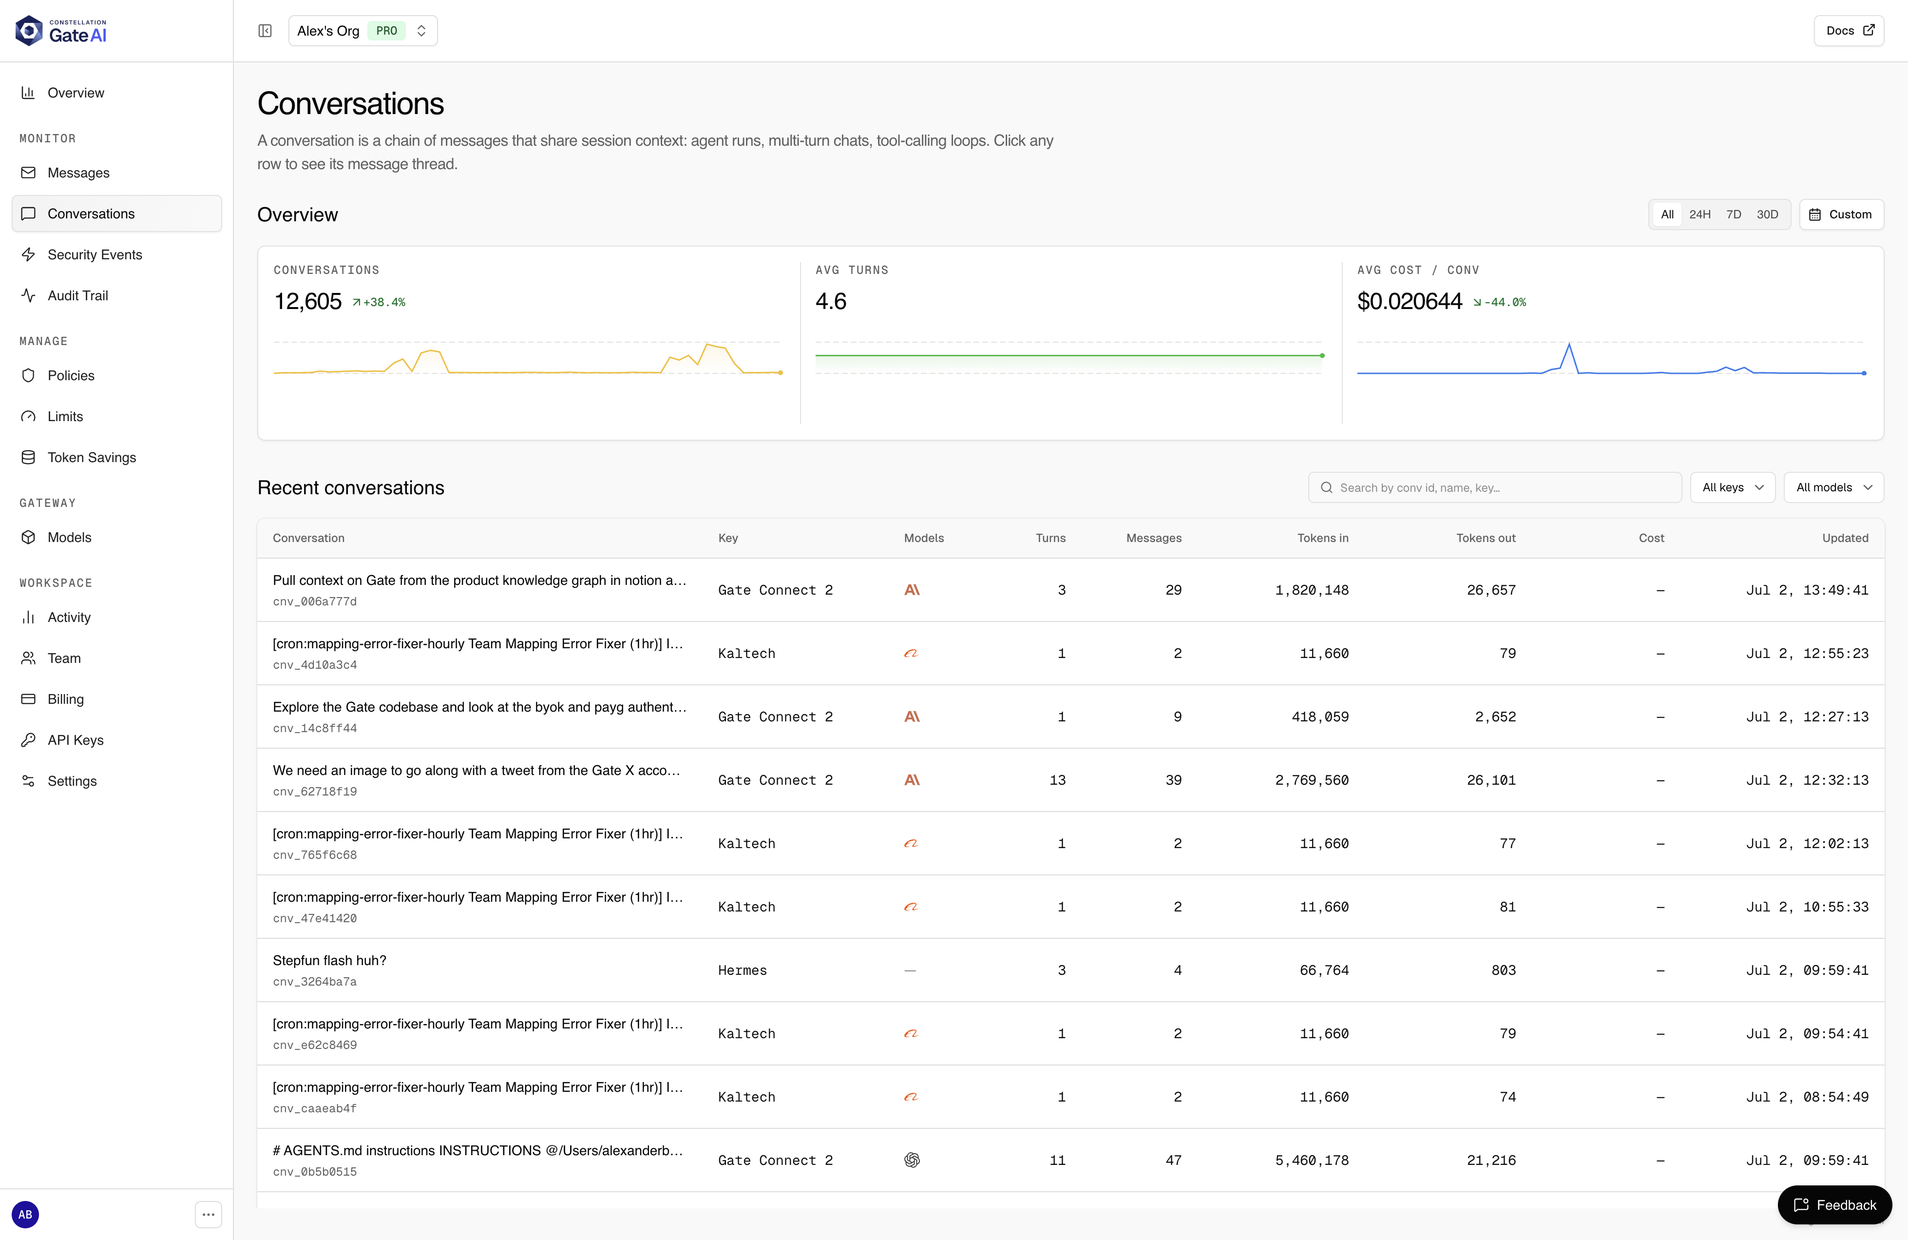
A conversation is a chain of messages that share session context: an agent run, a multi-turn chat, or a tool-calling loop. Each row rolls up one session’s turns, message count, tokens, and cost; click it to read the whole thread end to end instead of scanning isolated calls. The overview tracks total conversations, average turns per conversation, and average cost per conversation over the period you select.
Security Events
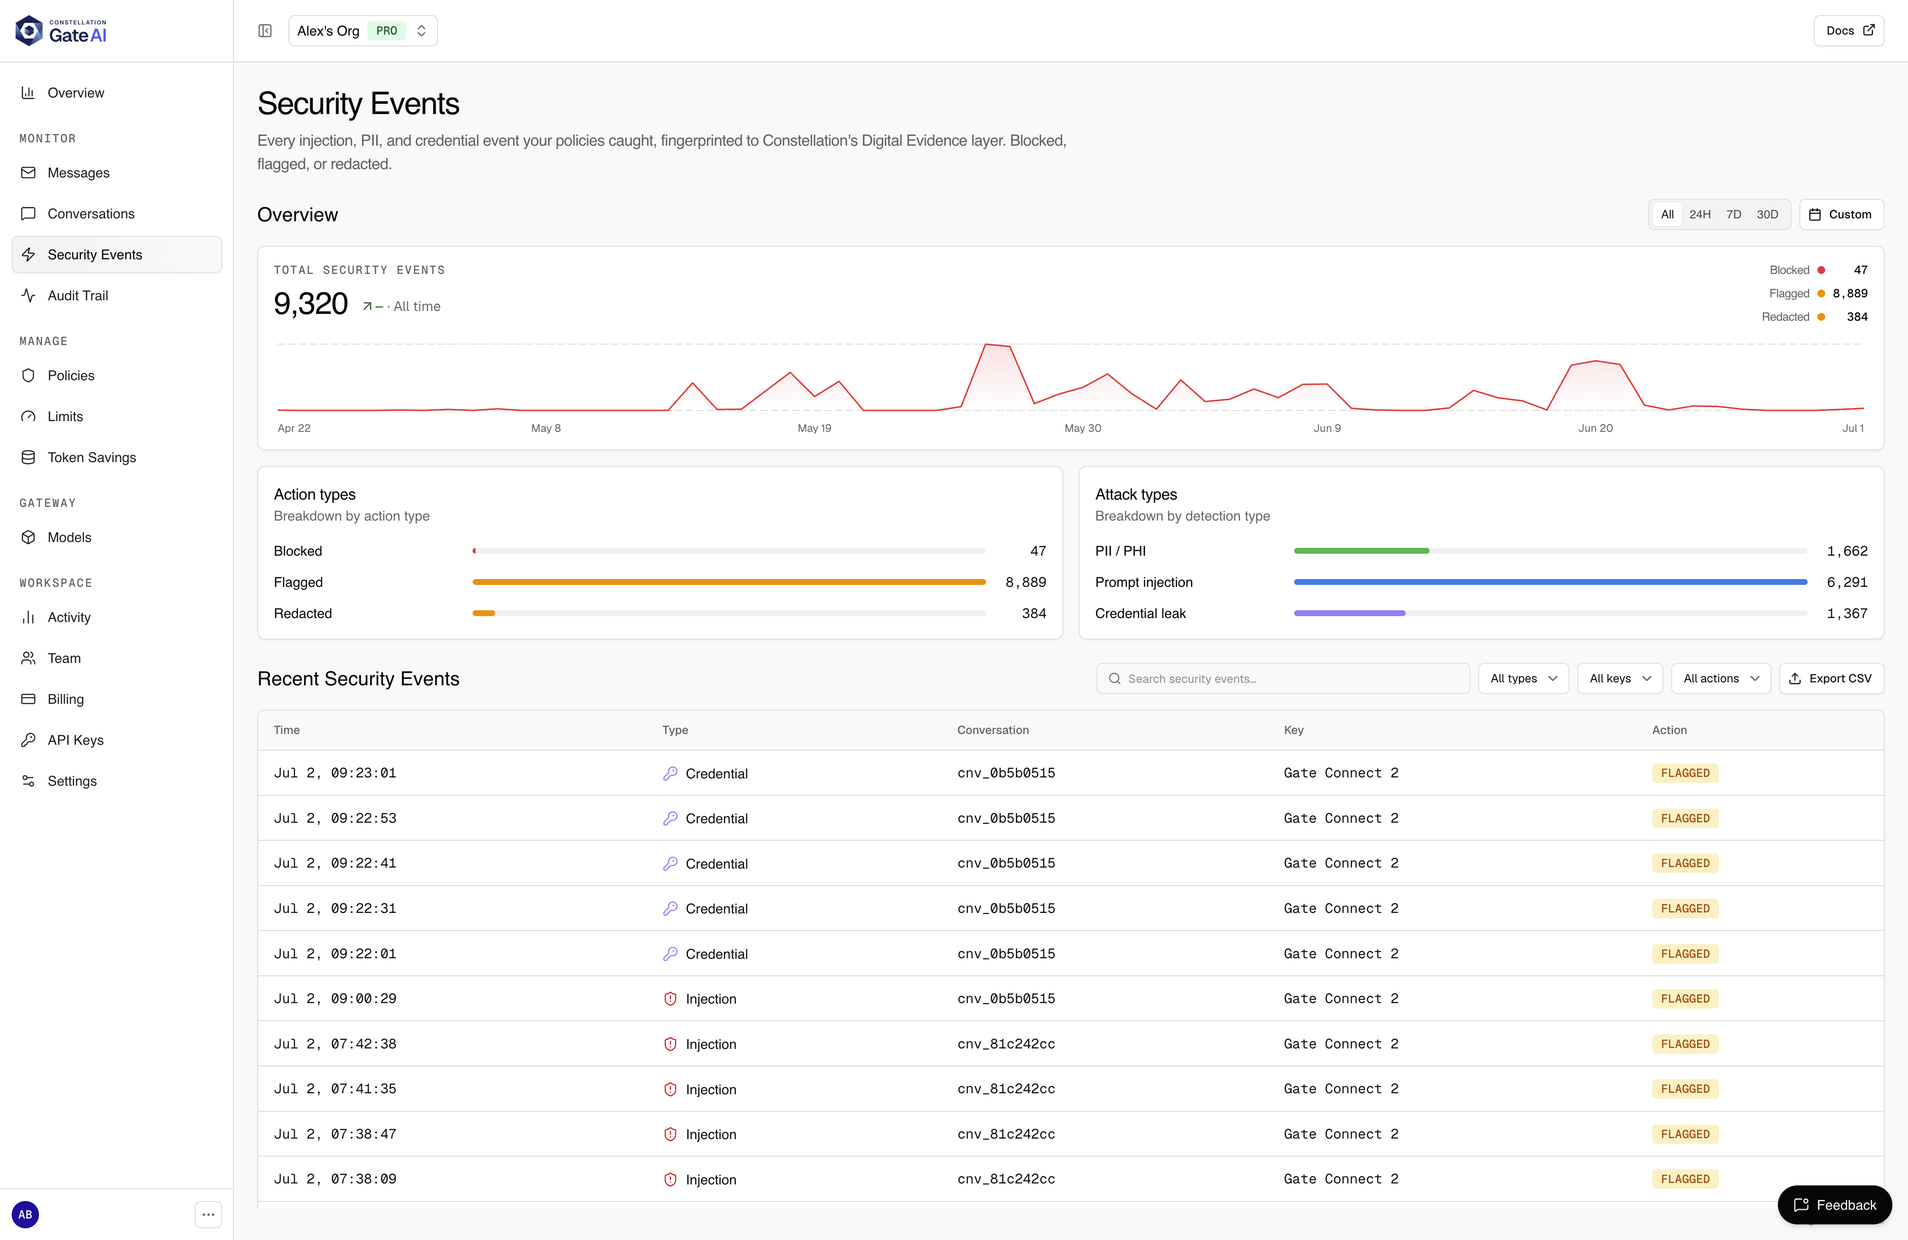
Every injection, PII, and credential event your policies caught: blocked, flagged, or redacted, each fingerprinted to Constellation’s Digital Evidence layer. The overview totals events over time and breaks them down two ways: by action (blocked, flagged, redacted) and by attack type (PII/PHI, prompt injection, credential leak). Below, the feed lists each event with its detection type, conversation, key, and action. Filter by type, key, or action, search the feed, or export it to CSV.
Audit Trail
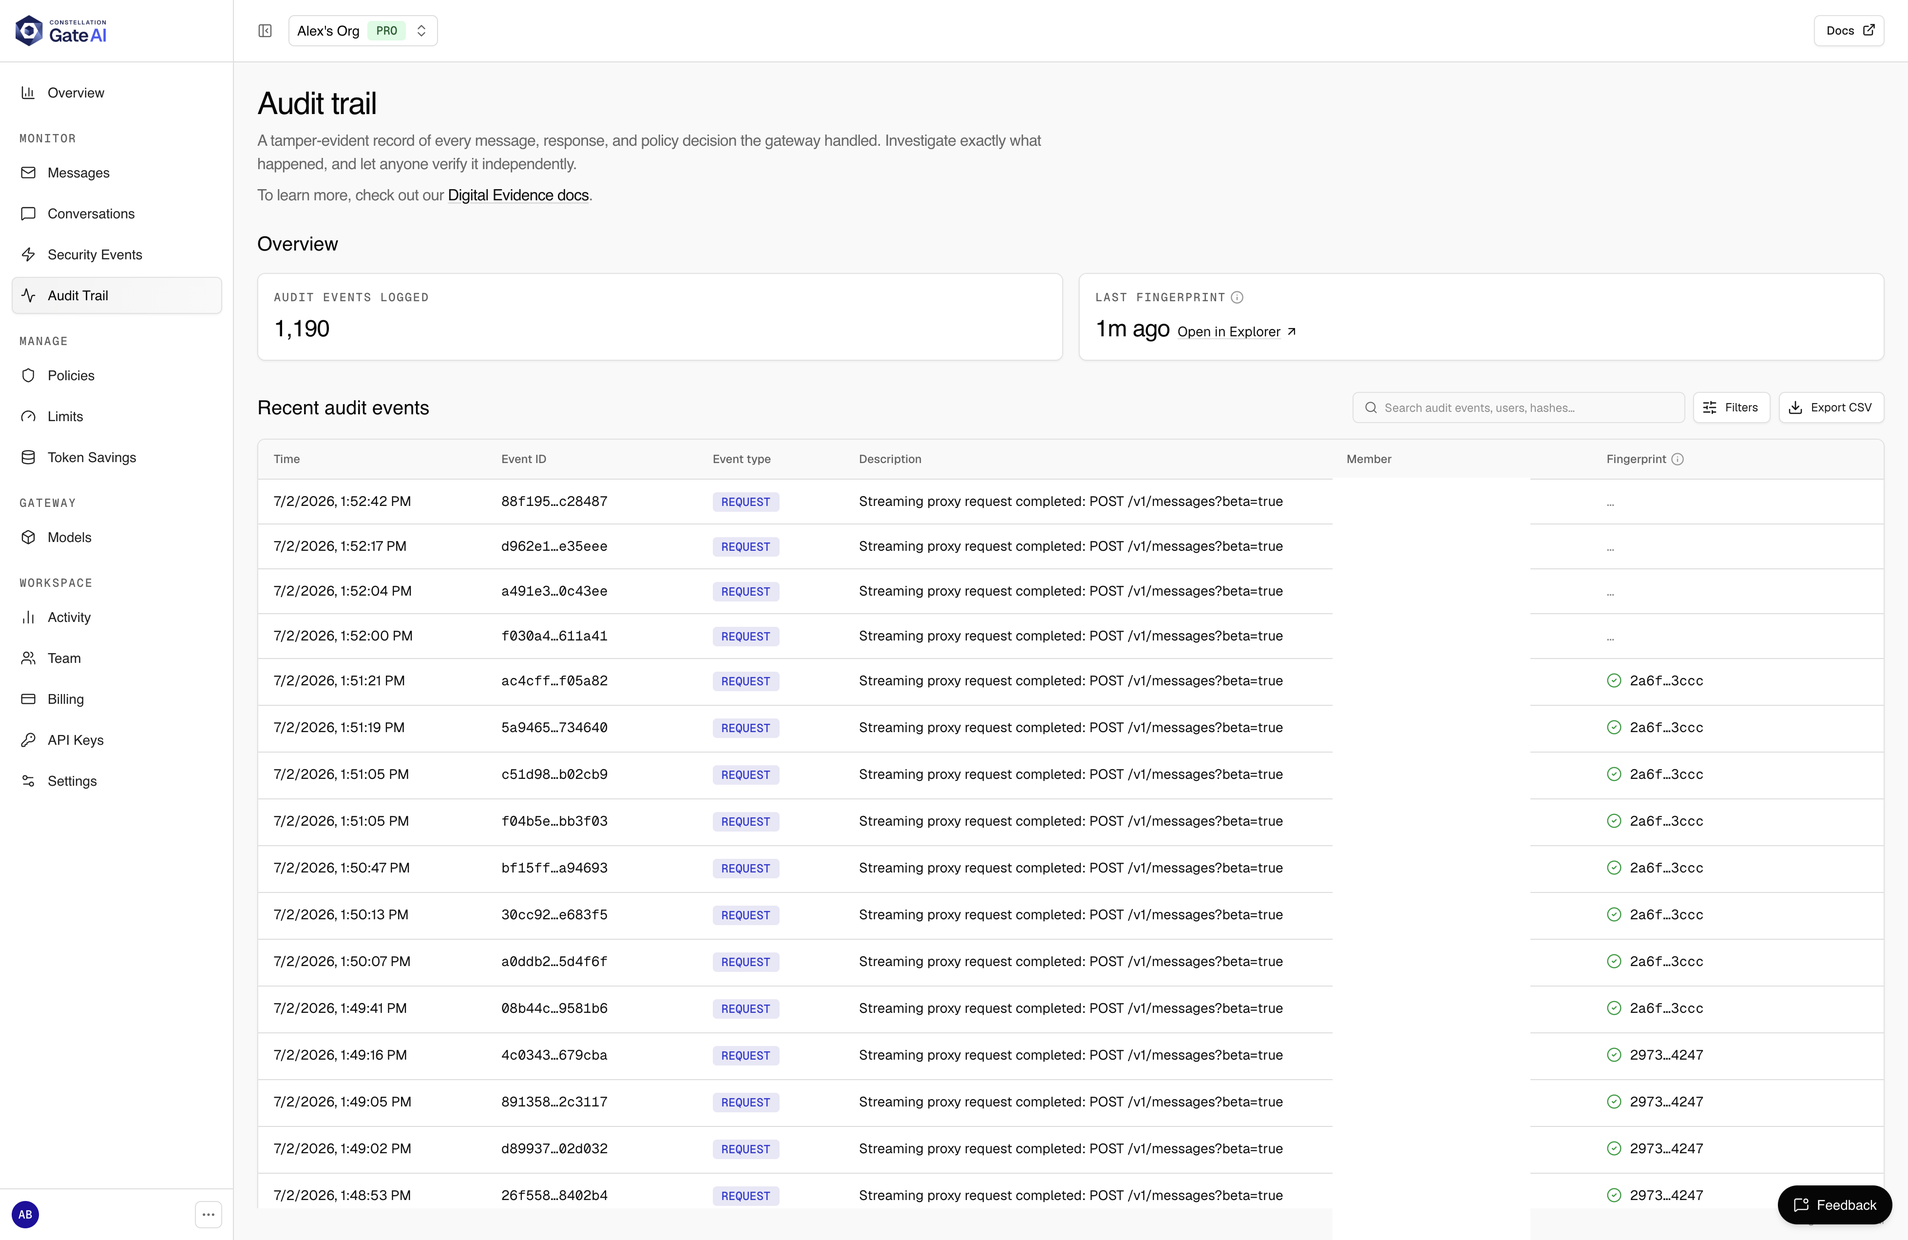
A tamper-evident record of every message, response, and policy decision the gateway handled. Each event is hashed and periodically fingerprinted to Constellation’s Digital Evidence layer, so anyone can verify independently that a record has not been altered after the fact. The overview shows how many events are logged and when the last fingerprint was anchored, with a link to open it in the explorer. Each row carries an event id, type, description, the member responsible, and its fingerprint; filter, search, or export to CSV.
Manage
The controls that shape how requests are handled.
Policies
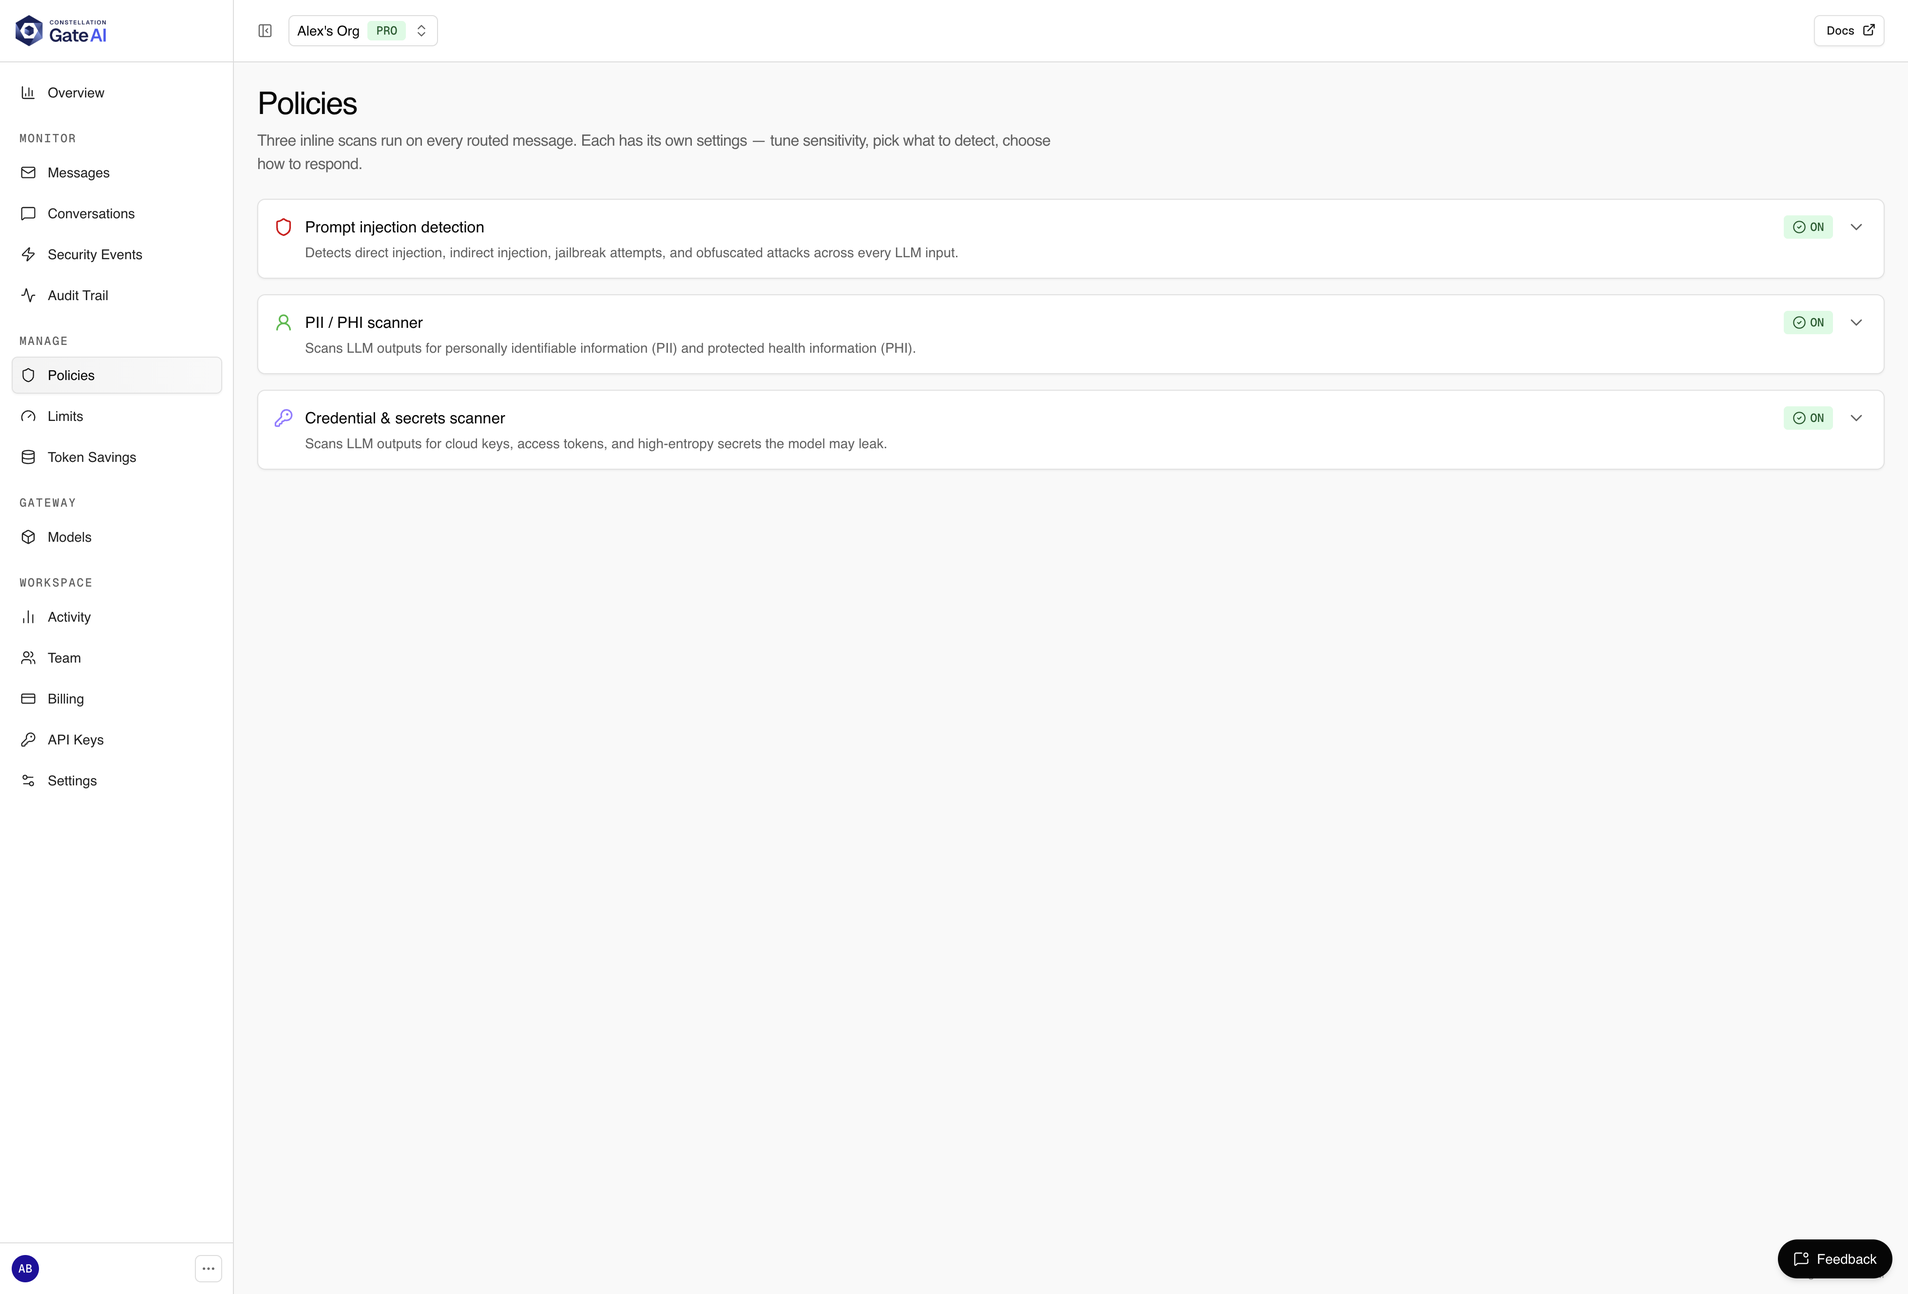
The three inline scans that run on every routed message: prompt-injection detection, PII/PHI redaction, and credential and secret leak detection. Turn each on or off, choose which phase it scans and what it detects, and choose how a hit is handled: prompt injection flags or blocks, and the two entity scanners add redact. Sensitivity is a prompt-injection setting, on Pro. A message’s detail view shows the result of each scan.
Limits
Rolling ceilings on spend, tokens, or request count, scoped to one API key, one member, or the whole organization. Set them so a runaway client cannot surprise you. Per-minute rate limits are separate: they live on the API key itself, and the org-wide one is operator-set.
Token Savings
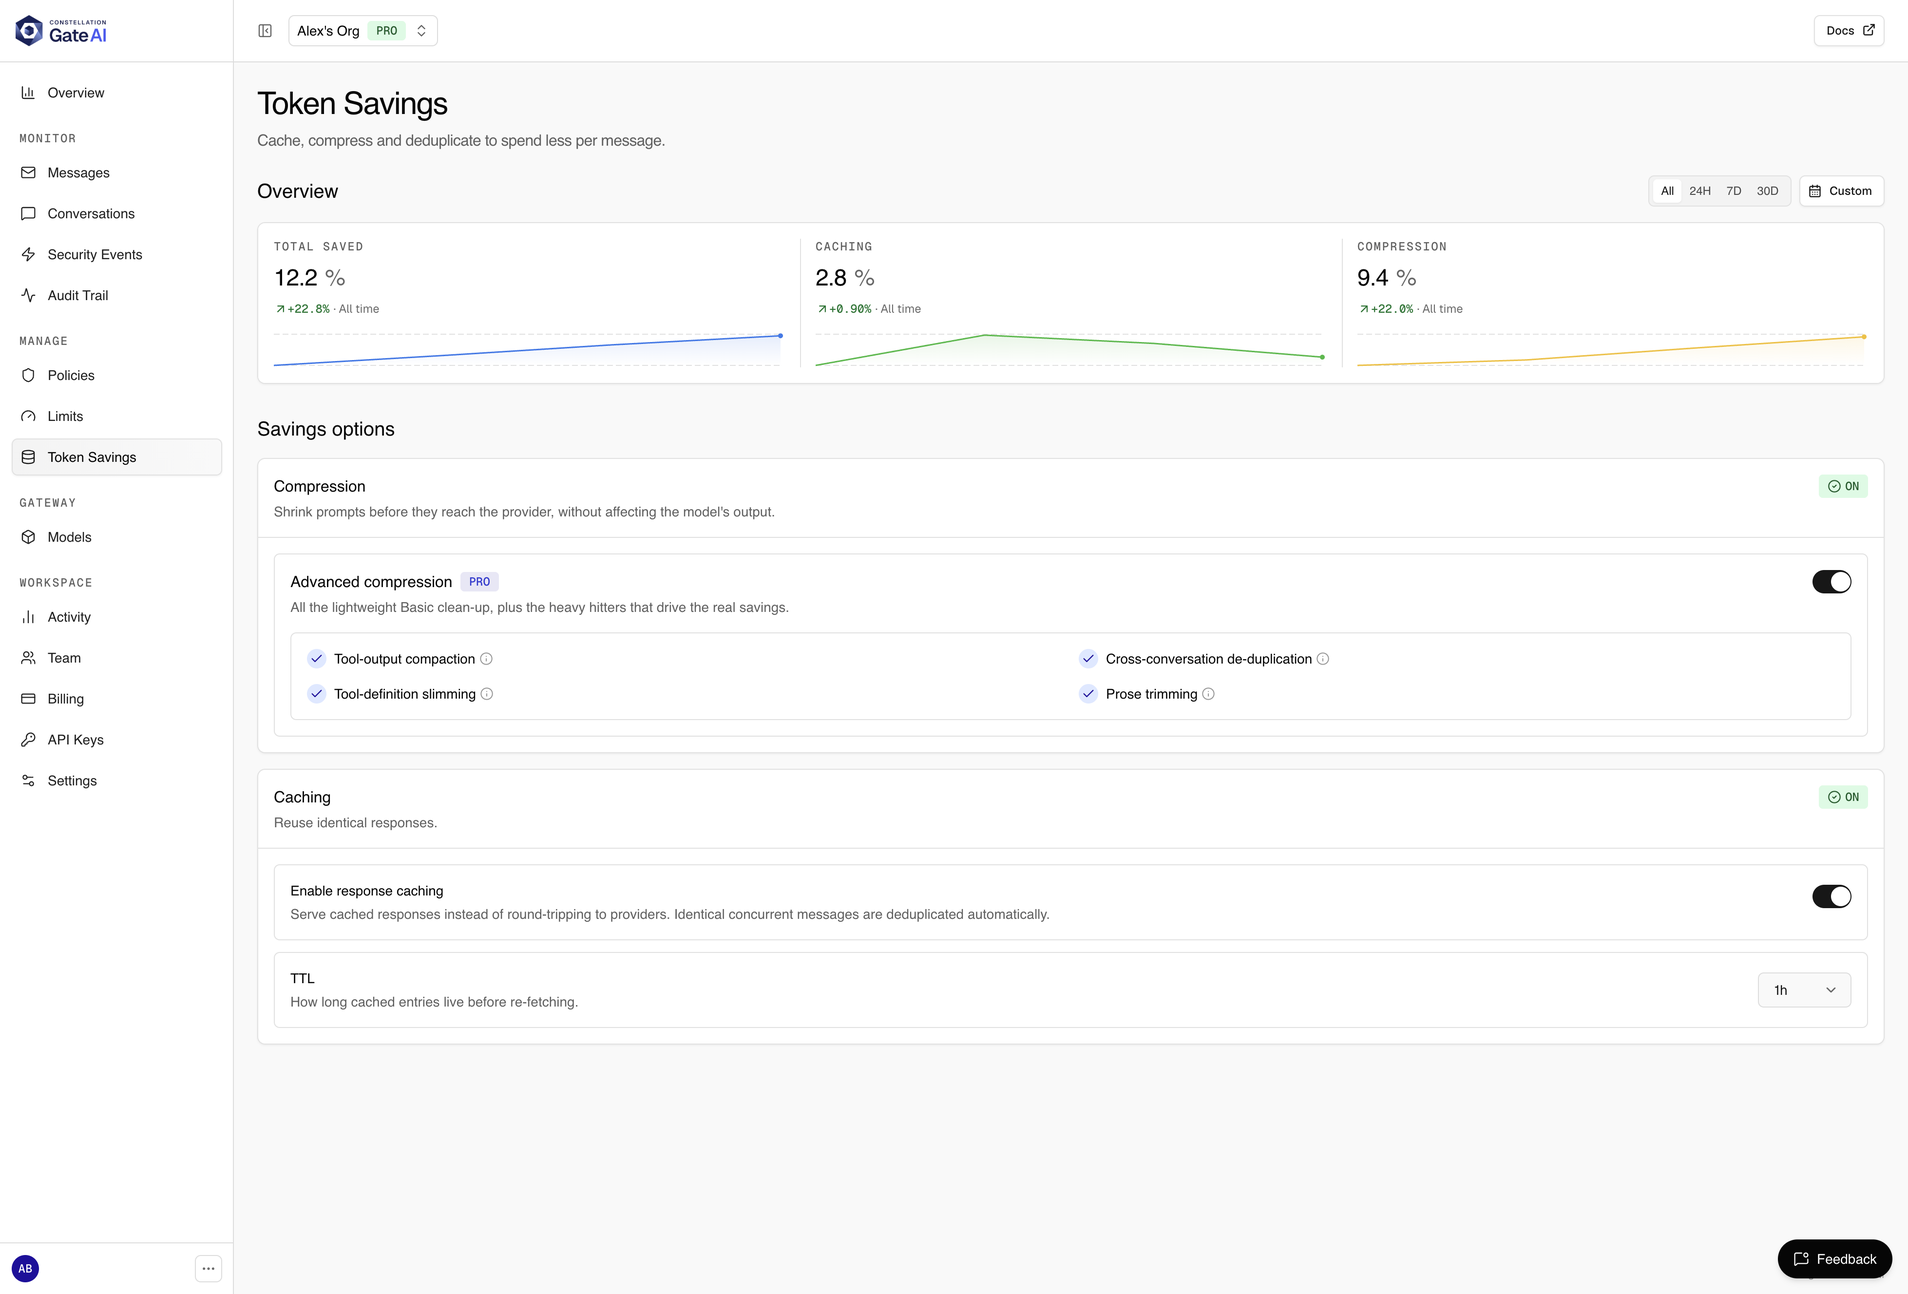
Caching, compression, and de-duplication, with a running tally of what they saved over the selected period. Turn on response caching (with a TTL) so identical messages are served without a round trip, and enable compression to trim input tokens before they reach the provider.
Gateway
Models
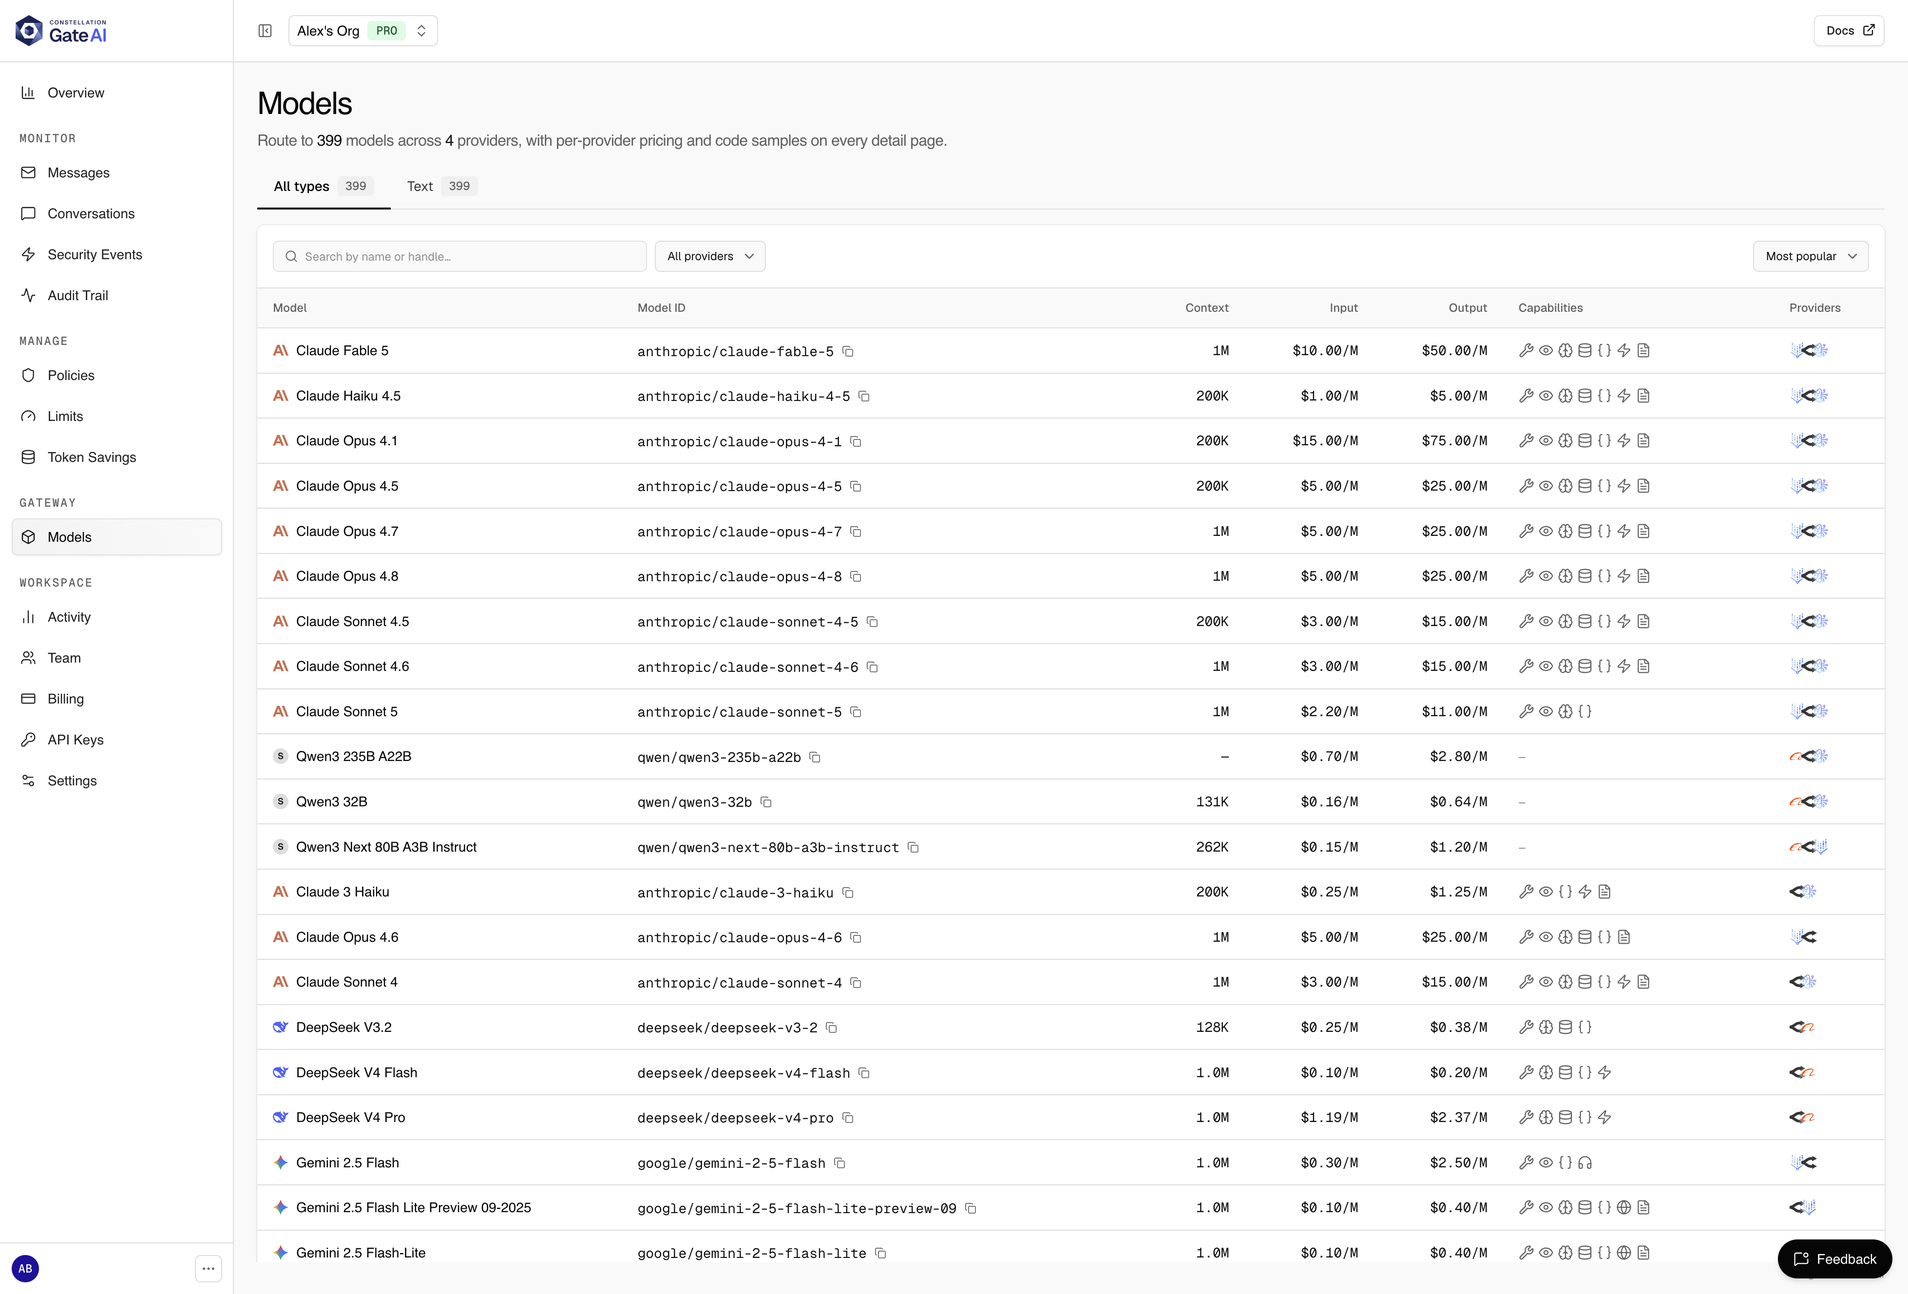
The catalog of every model Gate can route to across your enabled providers, with per-provider input and output pricing, context window, and capabilities. Each model has a detail page with code samples. This is where you find the provider/model id to put in your requests, and where owners and admins enable models or pin a preferred provider when more than one can serve a model.
Workspace
Account and team administration.
Activity
A friendly feed of who changed what: security decisions, key creation and rotation, billing transactions, and member changes.
Team
The members of the active organization, their roles, and pending invitations. Invite a teammate, change a role, or remove a member. See Teams and roles.
Billing
Your plan, prepaid balance, and payment method. Add credits here; changes open Stripe Checkout or the customer portal. See Plans.
API Keys
Create, name, rotate, and disable your Gate keys (sk-gw-…). Each key can carry its own usage limits and security policy. See Authentication for how keys authenticate requests.
Settings
Your own profile (full name, sign-in email) and the workspace name, which owners and admins can rename. Passkey enrollment lives here too, and so does organization deletion: it suspends access immediately and holds a 30-day grace period you can reverse from this page. Security policies are on the Policies page, not here.